With 7 games left in the regular season, a 37-12 record and a manageable schedule ahead, Clemson looks to be in a good place for a top 8 seed, but Monte Lee would tell you there's still business to take care of and he's right.
I'm a strong believer in numbers and metrics and things like the Pythagorean Theorem in baseball. I'm also a strong believer in Monte Lee, and these two items currently have me in a state of confusion.
On one hand, I realize regression in 1 run games is likely (who wins 1 run games at a 72% rate over the long term?). On the other hand, season 3 under Lee looks strikingly similar to years 1 and 2 with regards to 1 run games and at some point, you have to say "Yeah, some regression is likely, but his teams win one-run games."
| Season | Wins | Losses | PCT |
| 2016 | 14 | 6 | .700 |
| 2017 | 9 | 4 | .692 |
| 2018 | 13 | 4 | .765 |
| Total | 36 | 14 | .720 |
Clemson has played 176 games under Monte Lee, and 50 of them have been one-run games (28%) and in 2018 17 of 49 (35%) have been one-run affairs.
With Lee as head coach Clemson has a higher winning percentage in one-run games (.720) than all other games (.690).
Is it a Clemson thing?
A little more on the one-run games: Seventeen one-run games in a sample of 49 seems a bit high. In a highly unscientific study, I looked at the other top 10 RPI teams (at the time of completion) to see how those teams one-run games compared to the Tigers.
My primary hypotheses were that a) top teams don't play a lot of 1 run games and b) when they do, they generally win at a higher than 50% rate.
| Team | Games | 1 Run Games | % | Record in 1 R Games | Win % |
| Florida | 50 | 5 | 10.0 | 4-1 | 80.0 |
| Stanford | 44 | 5 | 11.4 | 4-1 | 80.0 |
| Georgia | 48 | 9 | 18.8 | 6-3 | 66.7 |
| North Carolina | 47 | 13 | 27.7 | 8-5 | 61.5 |
| Florida State | 49 | 11 | 22.4 | 5-6 | 45.5 |
| Arkansas | 48 | 15 | 31.3 | 7-7 | 50.0 |
| Clemson | 49 | 17 | 34.7 | 13-4 | 76.5 |
| Auburn | 49 | 12 | 24.5 | 7-5 | 58.3 |
| Texas Tech | 50 | 4 | 8.0 | 2-2 | 50.0 |
| Oregon State | 44 | 11 | 25.0 | 10-2 | 83.3 |
| Total | 478 | 102 | 21.3 | 66-36 | 64.7 |
The top 10 RPI teams average 10 one-run games (rounded) and a 64.7% winning percentage in those games. Clemson is significantly higher in both categories, and the Tigers have more one-run wins than any other team.
Here's the breakdown for Clemson in one-run games by RPI buckets:
| 1-50 | 51-100 | 101-150 | 151-297 |
| 5-3 | 4-1 | 1-0 | 3-0 |
For the most part, Clemson is not beating chumps in those one-run contests, with the three on the far right being the opening series against William and Mary.
Three "Peays" in a Pod
On the surface, the upcoming three-game series with Austin Peay appears to be a low-stress affair, with an opportunity for Clemson to burnish their resume on the way to hosting a regional, and perhaps if the brooms come out, a Super at Doug Kingsmore Stadium.
That said, the Tigers have a lot more to lose than the Governors this weekend as it seems that anything less than a sweep will be seen as a setback in those Super dreams.
| Team | Record | RPI | SOS | vs. Top 50 | vs. 51-100 | vs. 100+ |
| Clemson | 37-12 | 11 | 33 | 13-9 | 10-3 | 14-0 |
| Austin Peay | 29-20 | 107 | 177 | 0-5 | 3-2 | 26-13 |
Tale of the Tape
The Tigers are up to .255, but Austin Peay has the lead in all of the offensive categories below. The biggest difference statistically speaking of these two teams is in the ERA category. While not as high as Western Carolina's ERA, 6 and a half earned runs per game does not bode well for the Governors.
| Team | Batting | OBP | Slugging | ERA | WHIP | Fielding | Scoring |
| Clemson | .255 | .373 | .444 | 3.49 | 1.28 | .975 | 6.2 |
| Austin Peay | .282 | .391 | .458 | 6.48 | 1.71 | .963 | 7.6 |
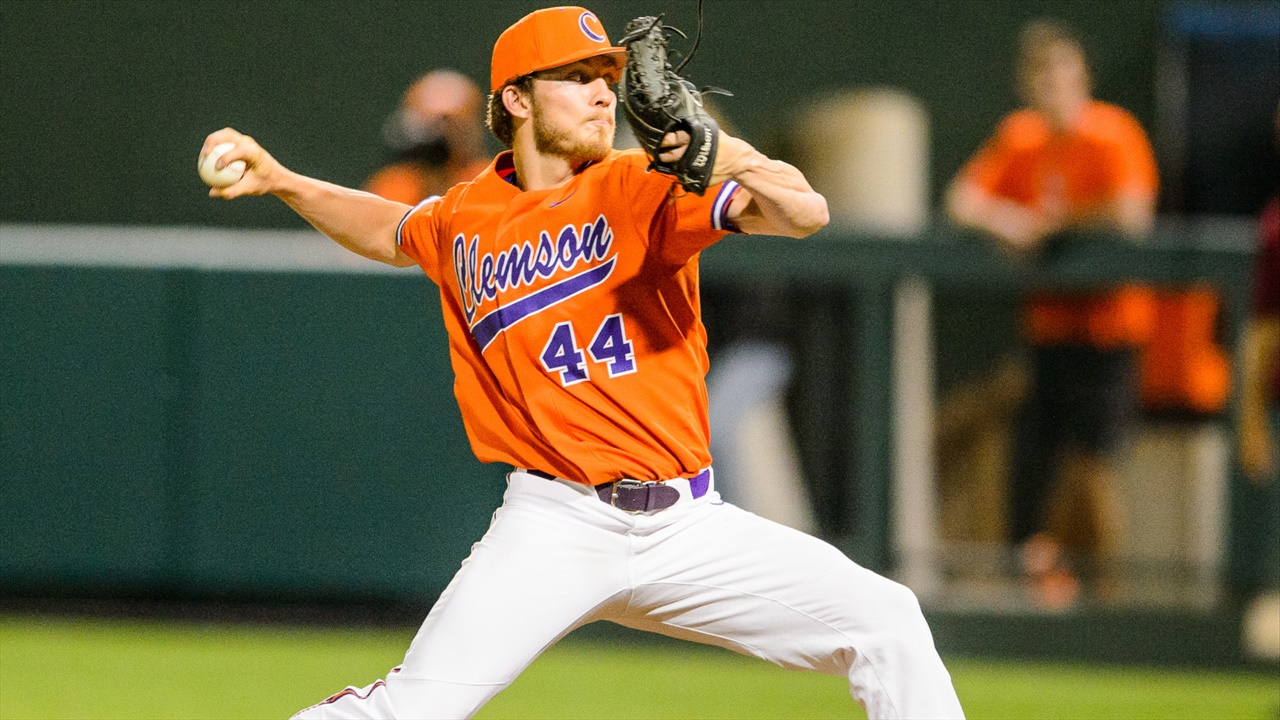
The Tigers have had the same weekend rotation since opening day with Jacob Hennessy, Brooks Crawford, and Jake Higginbotham all getting 12starts. The trio has been solid, if unspectacular, and you generally know what you are getting when they take the mound.
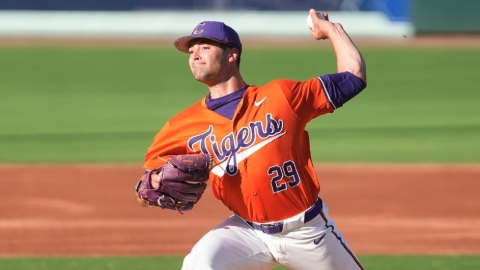
Pitching
This team has been marked by outstanding bullpen work, and it'll be interesting to see how the staff is managed in the weekend series against Austin Peay. Suffice it to say we won't be seeing 90 pitches out of Ryley Gilliam this weekend.
Leading Off
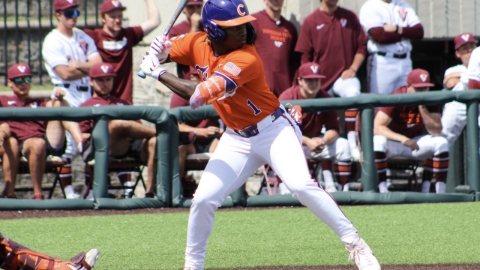
Batting
Batting with RISP
Hitting for a high average is one thing, and it's obviously important to get on base, but high leverage situations are something the coaching staff pays close attention to and I've added this metric below.
Seeing these detailed numbers can assist in understanding the lineup moves made by the staff depending on the pitcher.
Quality At Bats
This metric is calculated in different ways by different teams and at times can be subjective depending on who is measuring the at-bat. The goal was to capture as much data as possible to better understand decisions made by the coaching staff.
Stats Overload? Check out our "Snapshot"
Too many numbers and charts? We've created this snapshot of both batters and pitchers for easy reference, and you can dig into the detail later.
Actual vs. Expected Record
A 13-4 record in one-run games has, at least temporarily, reduced the expected win metric close to useless. If you begin with the 38 expected wins and add the 4 "luck" wins, you still likely come up short of the Tigers eventual season win total considering the remaining schedule.
That said, over the years I've learned not to look at a schedule, especially in baseball, and assume wins and losses, so I'll let this play out till the end and see where the chips fall.
Of course, that could change over the weekend with a three-game series against a team with an ERA at 6 and a half, though 49 games in makes it difficult to move the needle much without a 20 run outburst.
It's important to note that the expected record doesn't look at the schedule ahead and assign wins and losses, but predicts the number of wins and losses based on runs scored and runs given up and assumes the current rate of runs scored and given up will continue through the year.
| Actual Record | Expected Record | "Luck" | Expected Season Record |
| 37-12 | 33-16 | +4 | 38-18 |
Resume
The Florida State series was a shot in the arm for the strength of schedule, but Austin Peay will hurt, as will Pittsburgh to a lesser degree.
| Record | RPI | SOS | RPI 1-50 | RPI 51-100 | RPI 101-150 | RPI 151-297 |
| 37-12 | 11 | 33 | 13-9 | 10-3 | 3-0 | 11-0 |
Upcoming Schedule
The Tigers look to be in good shape in the ACC (19-8) and overall with just over a week remaining in the regular season, facing no team with an RPI higher than 92.
| Date | Opponent | Location | Current Record | Current RPI |
| 5/11-513 | Austin Peay | Clemson | 29-20 | 107 |
| 5/15 | Kennesaw State | Kennesaw, GA | 24-22 | 92 |
| 5/17-5/19 | Pittsburgh | Pittsburgh, PA | 27-19 (11-13 in ACC) | 97 |
*Baseball resume information via WarrenNolan.com.